CSV to Graphs
Python Executable
This program was developed in conjunction with the Web Scrapper Chrome Extension, to help visualize the KPI information.
Description
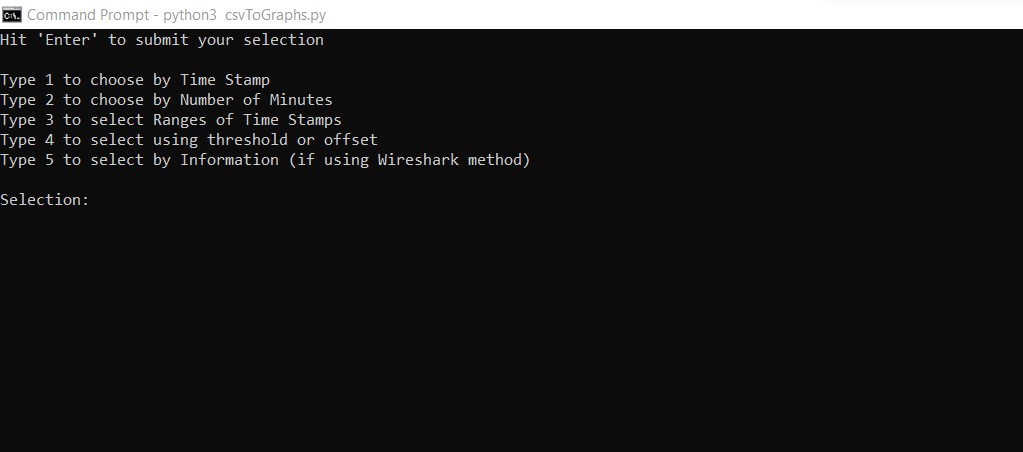
The CSVtoGraphs Python Executable is a post-processing program I developed to visualize KPI, throughput, and ping statistics as a graphical support aid. This program obtains the data collected from the Google Chrome Extension I previously created, and can display that data based on a user's needs. The Python Executable uses the numpy and matplotlib libraries to both parse the information as needed, and to display the correct information to the user.
Languages
Python